GDB Tips and Tricks #2: Setting Breakpoints with Regular Expressions

When debugging applications under gdb, the meek and mighty breakpoint is the cornerstone of just about everything we do. Breakpoints give us the ability to freeze time so we can inspect, and sometimes modify, the world in which our code is running. They can be used to “hit count” a body of count. You can even use breakpoints to automatically run commands within gdb.

So it’s no surprise that “break, or “b”, is one of the first few gdb commands we learn about. The problem with the “break” command, however, is that it allows you to set one breakpoint at a time (That is, unless you specify an overloaded function name as your break location. You’ll end up with multiple breakpoints in that case). If you need to set a lot of breakpoints, “break” can get very repetitive very fast.

Enter “rbreak”, or “rb”, to the rescue. The gdb “rbreak” command allows you to use grep-style regular expressions to set breakpoint locations. As an example, consider the following test fixture class.

struct TestFixture
{
    void setUp() { std::cout << "Method setUp()\n"; }
    void tearDown() { std::cout << "Method tearDown()\n"; }
    void testA() { std::cout << "Method testA()\n"; }
    void testB() { std::cout << "Method testB()\n"; }
    // ...
};

Let’s suppose that we want to add breakpoints on only the methods that start with “test”.

(gdb) rb TestFixture::test.*
Breakpoint 1 at 0x4008f2: file gdbtest.cpp, line 7.
void TestFixture::testA();
Breakpoint 2 at 0x400910: file gdbtest.cpp, line 8.
void TestFixture::testB();
(gdb) info breakpoints
Num     Type           Disp Enb Address            What
1       breakpoint     keep y   0x00000000004008f2 in TestFixture::testA() at gdbtest.cpp:7
2       breakpoint     keep y   0x0000000000400910 in TestFixture::testB() at gdbtest.cpp:8

This gave us two breakpoints in this example.

What if I want to set breakpoints for every function in a given file? While not really a regular expression, “rbreak” allows you set these like so.

(gdb) rb TestFixture.h:.
Breakpoint 1 at 0x4008b6: file TestFixture.h, line 5.
void TestFixture::setUp();
Breakpoint 2 at 0x4008d4: file TestFixture.h, line 6.
void TestFixture::tearDown();
Breakpoint 3 at 0x4008f2: file TestFixture.h, line 7.
void TestFixture::testA();
Breakpoint 4 at 0x400910: file TestFixture.h, line 8.
void TestFixture::testB();
(gdb) info breakpoints
Num     Type           Disp Enb Address            What
1       breakpoint     keep y   0x00000000004008b6 in TestFixture::setUp() at TestFixture.h:5
2       breakpoint     keep y   0x00000000004008d4 in TestFixture::tearDown() at TestFixture.h:6
3       breakpoint     keep y   0x00000000004008f2 in TestFixture::testA() at TestFixture.h:7
4       breakpoint     keep y   0x0000000000400910 in TestFixture::testB() at TestFixture.h:8

Note the single colon when using file names vs double colons when specifying class names.

There’s even a way to specify that you want breakpoints for all functions everywhere.

(gdb) rbreak .
Breakpoint 5 at 0x4008b6: file TestFixture.h, line 5.
void TestFixture::setUp();
Breakpoint 6 at 0x4008d4: file TestFixture.h, line 6.
void TestFixture::tearDown();
Breakpoint 7 at 0x4008f2: file TestFixture.h, line 7.
void TestFixture::testA();
Breakpoint 8 at 0x400910: file TestFixture.h, line 8.
void TestFixture::testB();
Breakpoint 9 at 0x4007e5: file gdbtest.cpp, line 4.
int main(int, char**);
Breakpoint 10 at 0x400899: file gdbtest.cpp, line 13.
static void _GLOBAL__sub_I_main();
Breakpoint 11 at 0x400865: file gdbtest.cpp, line 13.
static void __static_initialization_and_destruction_0(int, int);
Breakpoint 12 at 0x400640
<function, no debug info> _init;
Breakpoint 13 at 0x400670
<function, no debug info> std::ios_base::Init::Init()@plt;
Breakpoint 14 at 0x400680
<function, no debug info> __libc_start_main@plt;
Breakpoint 15 at 0x400690
<function, no debug info> __cxa_atexit@plt;
Breakpoint 16 at 0x4006a0
<function, no debug info> std::ios_base::Init::~Init()@plt;
Breakpoint 17 at 0x4006b0
<function, no debug info> std::basic_ostream<char, std::char_traits<char> >& std::operator<< <std::char_traits<char> >(std::basic_ostream<char, std::char_traits<char> >&, char const*)@plt;
Breakpoint 18 at 0x4006c0
<function, no debug info> __stack_chk_fail@plt;
Breakpoint 19 at 0x4006e0
<function, no debug info> _start;
Breakpoint 20 at 0x400710
<function, no debug info> deregister_tm_clones;
Breakpoint 21 at 0x400750
<function, no debug info> register_tm_clones;
Breakpoint 22 at 0x400790
<function, no debug info> __do_global_dtors_aux;
Breakpoint 23 at 0x4007b0
<function, no debug info> frame_dummy;
Breakpoint 24 at 0x400930
<function, no debug info> __libc_csu_init;
Breakpoint 25 at 0x4009a0
<function, no debug info> __libc_csu_fini;
Breakpoint 26 at 0x4009a4
<function, no debug info> _fini;

This, of course, includes a lot of standard library stuff that you probably don’t care about. So it’s not as interesting as it first might seem.

“rbreak” can save you a lot of time typing and trying to remember exact function names. It’s a super-handy tool to keep in your toolbox.

(p.s., if you accidentally set more breakpoints than you had intended, you can delete a specific breakpoint by using the “delete breakpoint [breakpoint-number]” command. You can get the breakpoint number from “info breakpoints”. To delete all breakpoints, use the “delete breakpoints” command).

GDB Tips and Tricks #1: A Tale of Two Terminals

It’s occasionally handy to be able to separate an application’s console I/O from that of gdb. Perhaps you’re debugging a particularly chatty application that’s preventing you from seeing what’s going on with gdb. Or maybe you’re debugging an ncurses application, a situation where gdb’s terminal I/O can actually interfere with the application’s UI.

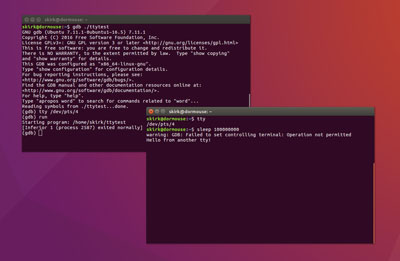
Fortunately, there’s a mechanism that allows your application’s console I/O to be handled in a completely different terminal than that of gdb. The gdb command is called “tty” (not to be confused with the command line tool “tty” which we’ll also be using here).

Step 1: Figure out the device file for the terminal where you want your app’s console I/O to be handled. In that terminal…

skirk@dormouse:~$ tty
/dev/pts/18

Note: It probably goes without saying, but the device path will vary from terminal to terminal.

Step 2: Put the shell in that terminal to sleep so it’s not competing with your application for I/O.

skirk@dormouse:~$ sleep 1000000

Step 3: In a second terminal, fire up gdb with your application.

skirk@dormouse:~$ gdb ./myapp
GNU gdb (Ubuntu 7.11.1-0ubuntu1~16.5) 7.11.1
Copyright (C) 2016 Free Software Foundation, Inc.
License GPLv3+: GNU GPL version 3 or later <http://gnu.org/licenses/gpl.html>
This is free software: you are free to change and redistribute it.
There is NO WARRANTY, to the extent permitted by law.  Type "show copying"
and "show warranty" for details.
This GDB was configured as "x86_64-linux-gnu".
Type "show configuration" for configuration details.
For bug reporting instructions, please see:
<http://www.gnu.org/software/gdb/bugs/>.
Find the GDB manual and other documentation resources online at:
<http://www.gnu.org/software/gdb/documentation/>.
For help, type "help".
Type "apropos word" to search for commands related to "word"...
Reading symbols from ./ttytest...done.
(gdb)

Step 4: Within gdb, set the device file path for terminal where your app’s I/O should be handled.

(gdb) tty /dev/pts/18

Step 5: Debug your app! Note: You may see a warning about GDB not being able to set the controlling terminal. This is safe to ignore.

Review: The Barr Group’s “Embedded Software Training in a Box”

Author’s Note: Since this review was published, the Barr Group released an updated version of their Embedded Software Training in a Box. The new version is almost half the price ($499) and all of the projects revolve around an ARM Cortex-M7 dev board. The dev board features an “Arduino-ready connection interface.” I’m not entirely sure what the means, but my interest in piqued. If anyone tries out the new version of the kit, please let me know what you think in the comments below. Thanks! -Shane (Aug. 23 2017)

I first heard about the Barr Group’s “Embedded Software Training in a Box” at Dan Saks’ CppCon talk “extern C: Talking to C Programmers about C++”. During the Q&A portion of the talk, someone had asked about breaking into the embedded software industry. Dan suggested the Barr Group’s course as a possible first step. I’ve worked in the embedded software world for a while. And I recognize weak areas in my skillset. Always looking for opportunities to learn and improve, I decided to give this course a spin.

The Barr Group’s “Embedded Software Training in a Box” is a cheaper version of their four day, in-person “Embedded Software Boot Camp”. Both courses share the same material and the same exercises, but the boxed kit is self-directed. There is no instructor and no peer support. At the time of this writing, the “Embedded Software Training in a Box” is $899. That’s a whole lot cheaper than $2,399.00, which is what the in-person boot-camp costs – a price difference of about $1500, plus whatever travel expenses you’d otherwise incur.

The Barr Group’s website provides a syllabus for the boot-camp. Major topics you can expect to learn about include idioms for embedded programming with C, memory management, multitasking, and interrupt handling, real-time OS concepts, and a few other odds and ends sprinkled in for good measure.

The Unboxing

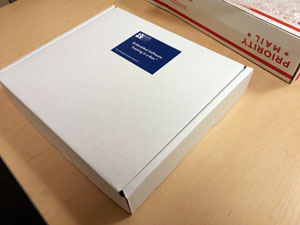
The following is a picture of what I received after purchasing the kit.


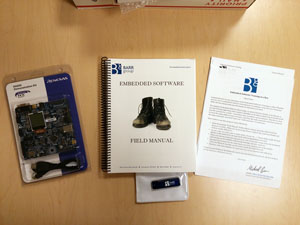
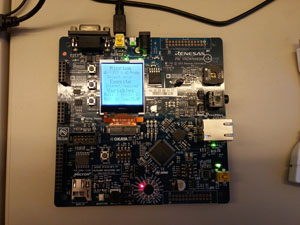
Within the box are five things – an RX63N Demonstration Kit from Renesas, ($105.19 from DigiKey at the time of this writing), a USB drive, an “Embedded Software Field Manual”, an exercise manual, and a quick-start letter.

The “Embedded Software Field Manual” is the cornerstone of this course. It’s intended to be the primary course material. This surprised me, however, as the field manual turned out to be a giant, spiral-bound print-out of all of the slides used in the boot-camp.

The USB drive contains a lot of things, including exercise projects, datasheets, various interesting magazine articles, a few e-books, and the Windows installer for IAR Embedded Workbench 7.0 – the compiler/IDE of choice for this course.

It’s worth noting that a license for IAR Embedded Workbench isn’t provided with the training material. In order to do any of the exercises, you have to obtain a trial license from IAR. Directions are included for how to do this. And there are actually two flavors of the trial license – a time boxed evaluation (30 days) and a code-size limited, time-unlimited evaluation. The training materials instruct you to choose the “Code size limited”, which is plenty sufficient for the exercises in this course.

The way the course works is that you read through the slides until you hit a “Hands-On” exercise. At that point, you’re redirected to the exercise manual which provides more details. Once you’ve completed the exercise, you return to the slides and keep going. Wash, rinse, repeat. There are nine hands-on exercises in total, and a “Cap-Stone” project at the end that’s intended to tie everything together. With the exception of the processor user-manual, the rest of the documentation on the USB drive is supplementary and can be read separately from the course.

Course Pros

  • The course covers a wide range of topics, including programming idioms, real-time OS concepts and scheduling algorithms, ADCs, UML state charts, interrupts, multitasking approaches, etc.
  • The Renesas demo board contains a variety of different types of components to play with.
  • Getting up and running with the Renesas board and IAR Workbench is super easy.
  • There are plenty of good supplementary articles and books provided on the flash drive.
  • The flow of the course feels very natural.
  • The hands-on projects are somewhat fun. (You can’t go wrong with blinky lights.)
  • Solutions to the exercises are provided.

Course Cons

  • As I said before, the “field manual” is just a collection of slides. Slides provide talking points. And without discussion around those talking points, a lot of information is lost. The vast majority of the slides are good. But there are a lot of places where more context is sorely needed. Sometimes acronyms are used without being defined, sometimes formulas are defined without any explanation of what they’re used for, and sometimes graphs are included that are just baffling. I confess I had to turn to YouTube at least twice for clarity on a few topics.
  • Many of the hands-on exercises are virtually impossible for the uninitiated to complete without looking at the solutions.
  • If you’ve never read a data sheet before, you may feel a bit “thrown in the deep end”. The course definitely doesn’t provide a gentle introduction in that regard. When the exercise manual says something like, “Familiarize yourself with such and such 50 pages of the processor data manual”, they really mean read all 50 pages.
  • No discussion of embedded Linux.
  • The tooling used for the course isn’t cross-platform. It requires Windows.
  • No course videos.
  • No online forum to discuss material.

Conclusion

This course is just OK, in my opinion. There are definitely some good nuggets of information. The exposure to μC/OS-III was new to me and I enjoyed that. But overall, I was kind of disappointed. The slide format didn’t really work for me. And the exercises, while interesting, sometimes felt a little disconnected from the “field guide” material.

The course could have benefited greatly from some online videos. At the very least, some discussion forums. For a $899 self-directed course this day and age, one expects such things.

The good news is that at the time of this writing if you’re interested in attending the in-person, boot-camp within a month of purchasing the boxed kit, the Barr Group will refund the cost of the kit so long as you bring it with you to the boot camp.

Do I recommend “Embedded Software Training in a Box”? It depends. If the company you work for has a good training budget and is willing to pay for it, sure, go for it. It’s not bad. If you’re paying out of pocket, however, I suggest maybe looking for alternative learning opportunities first.